Right now, most water and wastewater utilities have data that could dramatically transform and improve their operations. The challenge is that there’s often an overwhelming amount of disjointed data spread across various systems. How do you get the right data to the right people at the right time? Where do you start?
The answer isn’t buried in the dusty ones and zeroes of some antiquated report. People are the key, say BC’s Regional Practice Lead for Utility Performance Jeff Theerman, and technologists Jamie Lefkowitz and Ryan Pulis, to unlocking the power of data to optimize big picture utility and facility performance and make the most of the organization’s investment in data by putting it at their fingertips.

The right tools
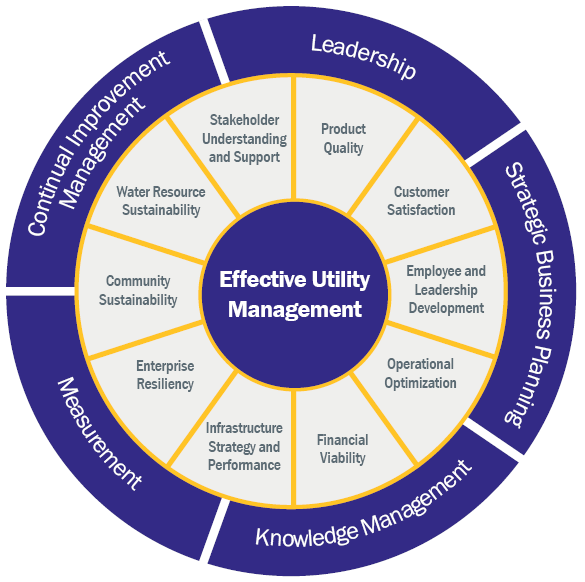
Effective Utility Management (EUM) is a framework used to measure your utility in a comprehensive way and track key performance indicators (KPIs) that aligns with your utility’s strategy. All you need are the right tools to get a better grasp.
“The best way,” says Jamie, BC’s National Analytics Engineering Lead, “is to start by talking with the people who are running the plant and talking with the people making decisions and learning how they want to do it better.”
With a common vision and goals in place, the real fun begins.
“Utilities are awash with data, much of which is siloed. It’s common to find that data sets are compartmentalized off in disparate systems, and the dots are not connected between them. Combining data sets together and exploring the relationships between them creates new insight that can save money and improve performance.”
Brown and Caldwell National Information Technology Consulting Lead Ryan Pulis
Meet BC:Opta™
That’s what makes BC:Opta — BC’s unique approach to utility optimization for a more effective future — so valuable.
“By combining people+technology+adoption, BC:Opta delivers Effective Utility Management dashboards and real-time analytics that foster an environment of collaboration and bring together technologies and subject matter experts from both the utility and BC,” Jeff says.
As BC:Opta solutions, EUM dashboards and real-time analytics are tools that are leveraged to enhance a utility’s strategic plan and facility performance by:
- Identifying specific needs and use cases
- Aligning solutions with a utility’s IT governance strategy
- Taking a step-wise method to build consensus
- Targeting dashboards at problems for immediate impact
- Building and documenting dashboards following organizational standards
- Exploring relationships between previously siloed data streams
Some of the benefits that utilities have achieved are optimization of gate control during wet weather events, energy and power optimization, and digester performance insights.
Dashboards
There are tempting readymade options available in the marketplace today, but to achieve meaningful and measurable results takes precision.
“Dashboards aren’t new, but making useful dashboards lies beyond the ‘grab and go’ mindset of one-offs and pretty pictures,” Jeff says. “It requires centralized dashboards that are structured around a utility’s strategic and operational goals, a single source of truth that can be adopted throughout the organization.”
To help organize the data and set up key performance indicators (KPIs) to monitor continuous improvement, the EUM framework provides visibility into how those various KPIs are contributing to the overall strategic goals of the organization.
“Aligning data insights with specific utility goals in a way that is optimal for the user to make decisions is what makes dashboards a powerful tool.”
Brown and Caldwell Regional Practice Lead for Utility Performance Jeff Theerman
The next step is making sure the dashboard is standardized and properly documented so utility staff can run it and adapt it as technology advances.
“Dashboards are often poorly documented and hard to maintain, particularly if it is built in isolation from an overall organizational data strategy,” Ryan explains further. “For instance, it can be difficult for an end user or a data manager to determine what math is going on behind the scenes in a dashboard, who built it, and whether it is using the appropriate datasets. That’s why proper documentation and standardization is critical for sustainability.”

Real-time analytics
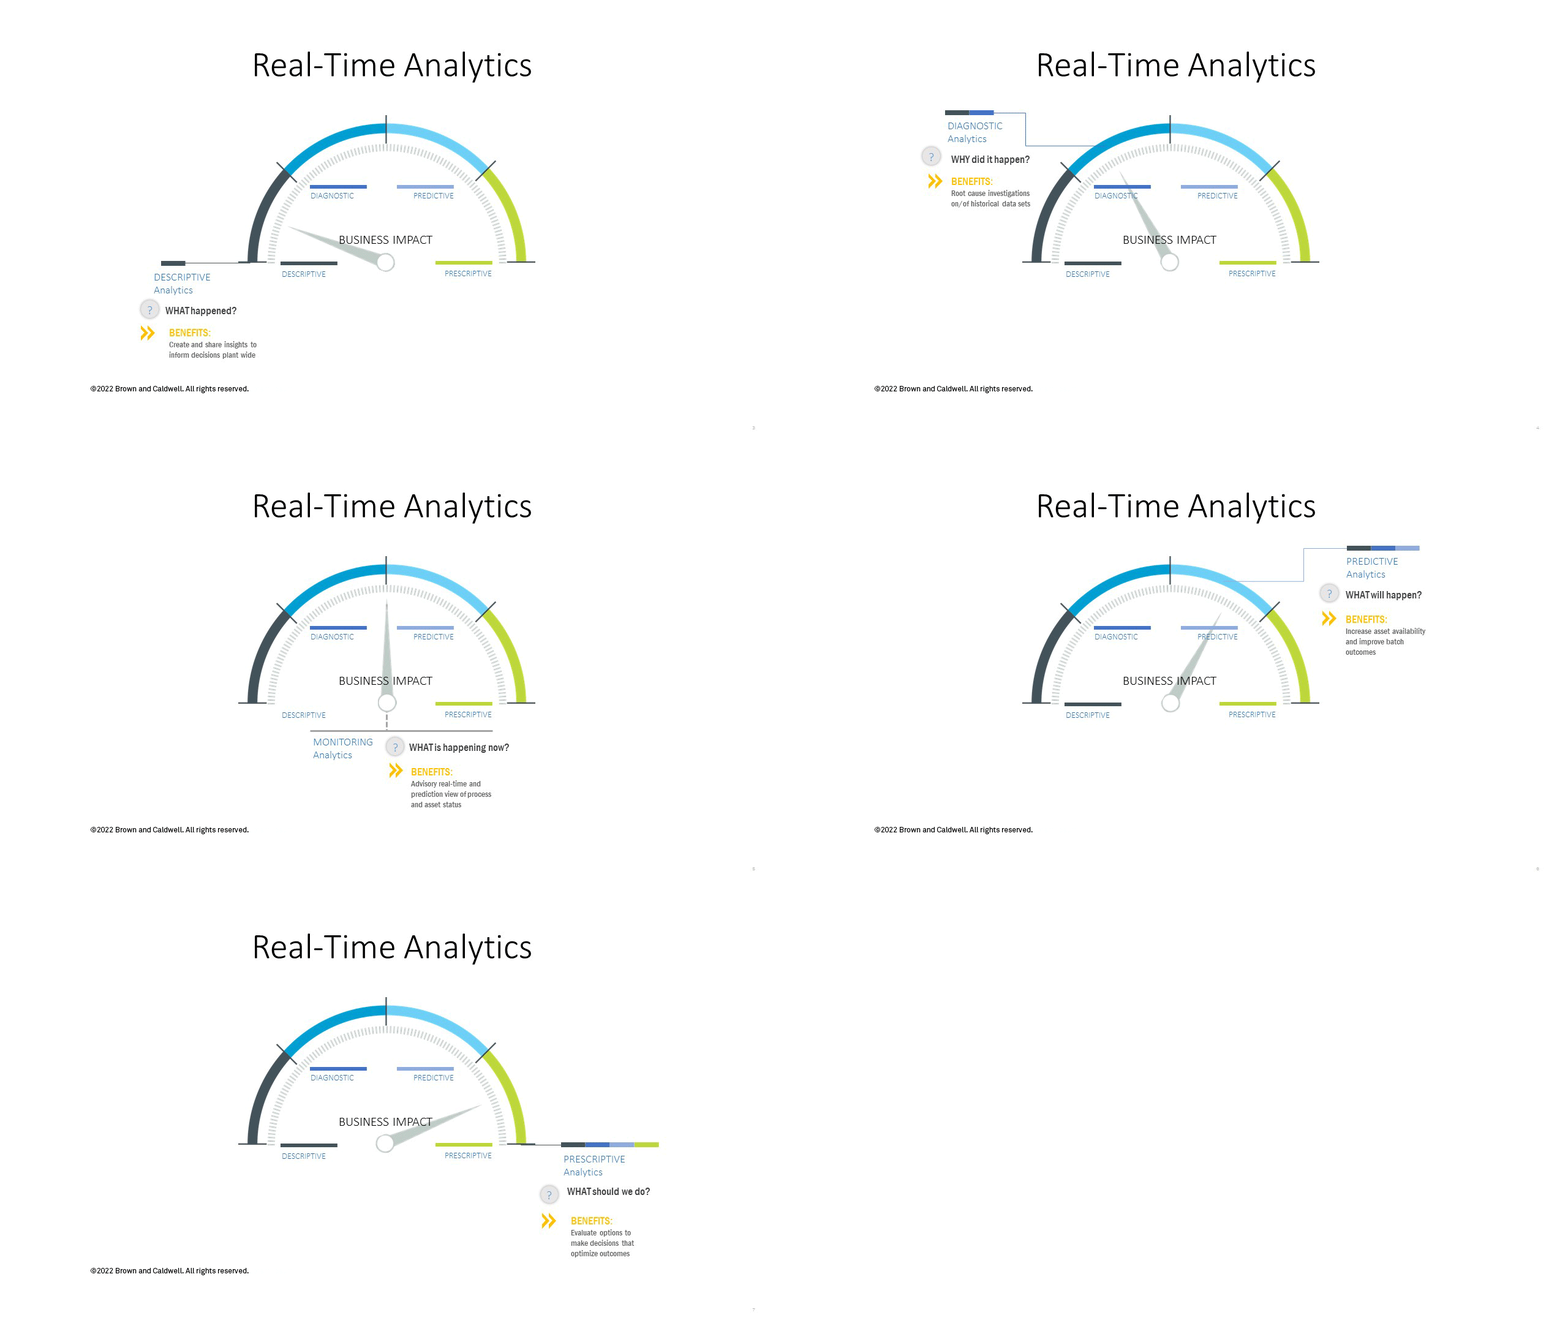
Another solution that leverages the power of data and people is real-time analytics.
“We now have affordable access to analytical tools that make it possible to solve problems that we couldn’t solve before,” BC’s Regional Practice Lead for Utility Performance says.
Utilities collect vast amounts of data every second, from SCADA systems to computerized maintenance management systems (CMMS) to GIS to customer information. Real-time analytics takes data from the source and applies advanced mathematics to draw out relationships and key understandings that facilitate more efficient and impactful decision-making.
In the case of utilities, Jamie points out that real-time analytics “allow them to be more proactive using the data they’re already collecting to improve operations.”
“We can automate complex reporting, alert to issues that aren’t indicated by SCADA alarms, combine data sources to develop correlations and predictions in real time. That’s very powerful to optimize facility operations.”
Brown and Caldwell National Analytics Engineering Lead Jamie Lefkowitz
To do this, BC partners utilize advanced analytics software to collect data and make it accessible in real time.
“There is almost always a SCADA historian constantly recording all of their data,” Jamie adds. “Software accesses that data and makes it available to powerful computational engines. Then we can do really cool things with the data and produce immediate insights into operations. It’s very secure and a one-way street.”
Like EUM dashboards, BC has also successfully delivered real-time analytics solutions to clients. For example, in the Pacific Northwest, a utility faced a unique challenge: It had industrial end users along a water transmission line and could not predict their demand.
Reacting to changing demands along the line had required inefficient pump operations in favor of flexibility to change the flow quickly. Real-time analytics can predict those user demands, providing information that operators need to determine when to run the pumps at their most efficient flow rate without compromising delivery, leading to energy and cost savings.
Source water quality is another predictable change that operators were not able to accommodate before implementing predictive analytics. Weather and streamflow forecast data can be transformed by analytics into source water quality predictions. This advance warning gives operators a chance to pre-adjust chemical dosing before turbidity spikes, optimizing chemical usage and minimizing treatment upsets.
More examples:
- Wastewater treatment: Adjust disinfection dosing based on real-time water quality measurements
- Wet weather: Predict CSO occurrence, predict downstream water quality impact of overflows
- Water treatment and distribution: Predict when each filter will need backwash
- Pumping: Predict demand to optimize energy usage
- Water quality: Prepare for forecasted source water quality spikes before they happen
“Having access to data in real time is critical,” Jamie reiterates, “but really it’s starting with the people, especially in operations, to find out what information they would need to make the best decisions every day.”
Cybersecurity
Of course, just as critical is ensuring that data, whether it’s in a dashboard or real-time analytics, is secure.
Compliance with an organization’s IT governance and cybersecurity posture is especially important when building dashboards that access data from secured systems, integrating real-time data from the SCADA network or IoT sensors, and serving an audience distributed across multiple organizations. Failure to architect a robust, secure information architecture for dashboards to access can cause security exposure and all the impacts that come along with it.
As Ryan emphasizes, “a critical feature of our approach is collaborating closely with a client’s IT group to have compliance with cybersecurity and other governance policies baked into our data access and dashboarding approach. All parties need to be comfortable with the solution and confident that we’re not exposing anyone’s information inappropriately.”
The future
Now is the time to make the investment as extreme weather events multiply, regulations change, infrastructure ages, and staff retire. Harnessing and leveraging data correctly can build resiliency and reduce costs now and in the future.
With the right tools, an optimized EUM Program can help measure utilities in a comprehensive way that helps them achieve their long-term goals.
“We need to get the people and adoption pieces to fit together,” Jeff adds. “Adapting their workforce for the future to be ready for new technologies that come along and get the right tools and the right data in their hands so they can operate the plant and not fall behind on technology.”
In the long run, data without people just doesn’t compute.


