
The road to the Utility of the Future is pockmarked with seemingly endless obstacles for water managers, but an emerging toolkit of resources and best practices is starting to make this journey a bit smoother. A fresh set of planning methods and innovative business approaches are at the center of a universe of options for the water profession.
Since the 2008 economic downturn, declining residential property values and the resulting financial squeeze for utilities spurred them to investigate how they could do more with less, integrating innovation and adaptability into their operations. Nationwide, utilities are showing their resourcefulness by incorporating cutting-edge tools for maximum efficiency — preparing for risks and improving operations to keep costs down while maintaining the highest level of service.
These tools are enabling utilities to illustrate their value to the public and affirm the importance of the task at hand — being a steward of the critical infrastructure that serves as the backbone of our communities. Here are a few examples:
Practical asset management helps St. Louis make better decisions
The Metropolitan St. Louis Sewer District (MSD) is like a lot of other communities that are faced with the need to make smart decisions with limited budgets. MSD is required to make major infrastructure improvements resulting from a consent decree and plans to spend $4.7 billion during the next 23 years to improve its system to eliminate overflows. In addition to owning and maintaining the fourth largest collection system in the country, MSD also owns, operates and maintains seven treatment plants.
Like many other utilities, MSD is challenged with determining the best way to balance several competing priorities for capital and O&M dollars to meet its level of service commitments to ratepayers.
Asset management is not a new concept to MSD. It negotiated asset management into its consent decree and is proactive about meeting and routinely exceeding the district’s goals. MSD implemented a data dashboard to help its Operations Division better understand the condition of collection systems (pipes, sewers, manholes, etc.) and manage maintenance activities associated with these assets.
“It is a very practical approach, and the reality is it’s a survival skill for moving forward and something we feel very strongly about,” said Christopher Pfeuffer, Operations Division manager for MSD. “It forced us into a reporting model where we had to step back and say, ‘Is this effective?’ and also into a forecasting mode so that we could see areas of concern before they became a problem.”
 Building upon the success of the asset management components used for the Collection System, MSD wanted to implement asset management at its treatment plants. The vision of the Plant Asset Management Program is to responsibly sustain the infrastructure for generations to come. MSD wanted a practical, efficient and straightforward approach to asset management so it could make the right decisions first on the most critical assets.
This approach will allow MSD to optimize its limited dollars on the most important components of treatment operations right away. Overall, the asset management program that MSD is developing will lead to better decision making regarding operations and maintenance and long-term investment.
The project encompasses information management, communications, asset inventory, level of service/performance management, maintenance management and capital improvement programs. Unlike many asset management programs, MSD has chosen to involve key players from O&M, Engineering, Finance and Training. The program will help MSD standardize and evaluate all the plants, using the same approach, so that it is comparing apples to apples when making big decisions.
Water district brings strategic plan to life in Southwest Florida
The Southwest Florida Water Management District in Brooksville, Fla., knows a thing or two about maintaining a huge amount of sprawling infrastructure. SWFWMD is one of the state’s five water management districts, serving a population of 4.7 million residents and covers more than 10,000 square miles.
With the pressures of a changing climate, a growing population, dwindling water supplies, water quality degradation and an aging infrastructure, it is essential that the district has a clear path forward. To ensure success moving into the future, the district developed a strategic plan that created a vision for the future. Recognizing that this vision needed to be instilled into its operation, the district’s leadership decided to develop a business plan to establish how to achieve this vision and the necessary resources.
“Although the strategic plan answers the question ‘What does the district want to be when it grows up?’ where it falls short is in addressing the question, ‘How do we get there?’” SWFWMD Assistant Executive Director Brian Armstrong said. “The business plan is an operation manual. It helps you understand your staffing, your budget and your needs.”
To get buy-in and strip away the traditional siloes, the district divided all the aspects of its work into four areas of core responsibilities: Water Supply, Natural Systems, Water Quality and Flood Protection.
“It’s a change in mindset and it made us all less myopic,” Armstrong said. “It gave everyone a better understanding of the district as a whole and gave them a lot of hope.”
 This high level of engagement was key, he said. “More than 70 people were engaged in some facet of developing the business plan. They owned the results because they did all the legwork, all the heavy lifting. They’re the ones who are going to run the business; they’re the boots on the ground to execute the plan.”
Armstrong likens the business plan to an early-warning system: It forecasted near-term needs and identified challenges, such as putting into place an effective succession plan due to a wave of retirements on the way. “It’s a great exercise to go through. Even if you think you know what’s going on, you’ll find some new surprises,” he said.
With its new how-to manual, the district staff estimated the resources necessary to achieve the vision in the strategic plan and grew to understand the constraints placed on the agency by external stakeholders, Armstrong said. “I’m excited about the growth that happened within our staff once we asked them to work outside their comfort zone,” he said. “Many have become not just managers, but leaders.”
Business intelligence is the smart choice in Montgomery County, Md.
In 2013, faced with the daunting task of managing and tracking the performance of a mega stormwater management program, the Montgomery County Department of Environmental Protection in Rockville, Md., deployed a business intelligence dashboard that now monitors about 150 projects worth about $200 million.
New business intelligence software and analytics tools are making it easier for utilities to manage complex, multi-task programs involving large teams and stakeholders, said Brown and Caldwell Vice President Dane Jablonsky, who prefers the more descriptive moniker “business visualization.”
 Montgomery County is the first Phase I MS4 community in Maryland to negotiate and have in place a NPDES permit directly tied to compliance with the Chesapeake Bay TMDL. This compliance is in the form of an impervious cover restoration goal, which targets 20 percent of impervious surface restoration by 2017.
The county has identified $320 million of stormwater BMP retrofit and stream restoration projects required to meet the restoration requirements. Using a Microsoft SharePoint data management system and dashboard, DEP is monitoring the overall program and multiple projects from planning through design and construction.
“Instead of siloes of information around the organization, we can make knowledge available to everyone in a central location — cutting down on the duplication of information and efforts,” Jablonsky said. “Most importantly, the information you’re getting is better and more valuable.”
As an example, the visualization below presents each of DEP’s CIP projects as a bubble, with the size of the bubble representing the size of the project. In this visualization:
- Schedule compliance (i.e. days late) is shown on the horizontal axis
- Cost compliance (i.e. dollars over budget) is shown on the vertical axis
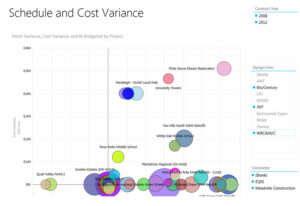
Inherent in business visualization is its interactive nature – the ability to drill and rotate around the data. Because of this, decision makers can use this single dashboard to answer multiple high level CIP performance questions, including:
- What is the relative performance of my design firms and contractors?
- Do I have a cost problem, schedule problem, or both?
- If the project is in trouble, is it of sufficient size to warrant our attention?
“Like the three rules of real estate — location, location, location — in business visualization it’s about presentation, presentation, presentation,” he said. “Visual elegance in reporting makes the information easier to interpret and enables us to make faster, better and smarter decisions.”
Implementing an industrial incentive policy in Idaho
The City of Nampa, Idaho, has been dealing with a slew of challenges resulting from a new NPDES permit that requires stricter phosphorus and temperature discharge limits for its wastewater treatment. Not only would a significant capital investment and rate increase be needed to achieve the new limits — an unpopular move among the city’s industrial customers to say the least — the Nampa WWTP was also reaching its design capacity, which could potentially force an even more expensive expansion as a result of unused industrial capacity.
Nampa found its answer in an innovative, two-pronged Industrial Incentive Policy, implemented in 2012. Not only does the policy incentivize industries to optimize their industrial capacity, it also incentivizes economic development — a priority for the city.
Nampa’s policy allows new and existing industrial customers to sell, receive a loan, lease or amortize the purchase of capacity. This approach incentivizes economic development in two ways:
- By providing industrial users with flexibility in the purchase terms of their wastewater capacity, industrial customers can select the payment approach that best fits their business interests without negatively impacting the utility.
- The policy creates a secondary market for capacity, in which the cost will always be lower than what the city can offer.
“Often, the water and wastewater connection fees can be a barrier for a company to relocate. Through the implementation of this policy, the city has been able to remove this barrier,” said Matt Gregg, Brown and Caldwell program manager for the city’s wastewater program. “It also turns your existing industry into recruiters, because if they have unused capacity, they have the opportunity to sell this to someone.”
The second part of the new policy is a Capacity Optimization Fee — this reduces the problem of unused industrial capacity and capacity speculation, both of which effectively makes a utility less efficient.
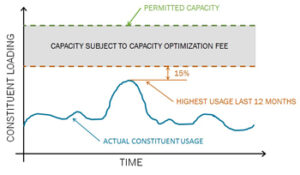 Essentially, the policy charges industrial customers for any unused capacity, above a threshold, that they have reserved through their industrial discharge permit. The threshold is set at 115 percent of the previous year’s maximum month usage; the fee is based on the city’s cost to maintain this capacity.
“Both of these resourceful approaches are a means of helping the City of Nampa meet its strategic goals through effective utility management and innovative financial policies,” Gregg said. “Not only has it helped the city achieve its goals of spurring economic development, it has delayed capital expenditures. The goal is to make the system more efficient, and it has.”